Strategy 15
A mean reversion trading strategy that trades XLV and operates exclusively on long positions. It leverages the Chaikin's Money Flow indicator combined with MACD to determine optimal times to enter and exit trades based on SPX performance as a breadth/regime filter.
This file will be updated for as long as the strategy is being developed, deployed (live or simulation), or distributed. Once it has been discontinued, it will be noted here. The code block will always reflect the most recent version of the strategy. The change log can be used to see changes and adjustments to the code over time.
Strategy Features:
- Day Trading Futures Strategy (Long Only)
- Trades XLV
- Utilizes Chaikin's Money Flow and MACD indicators to time entries and exits based on SPX performance
- Supports long trading strategies
- Commissions and slippage accounted for in backtest results
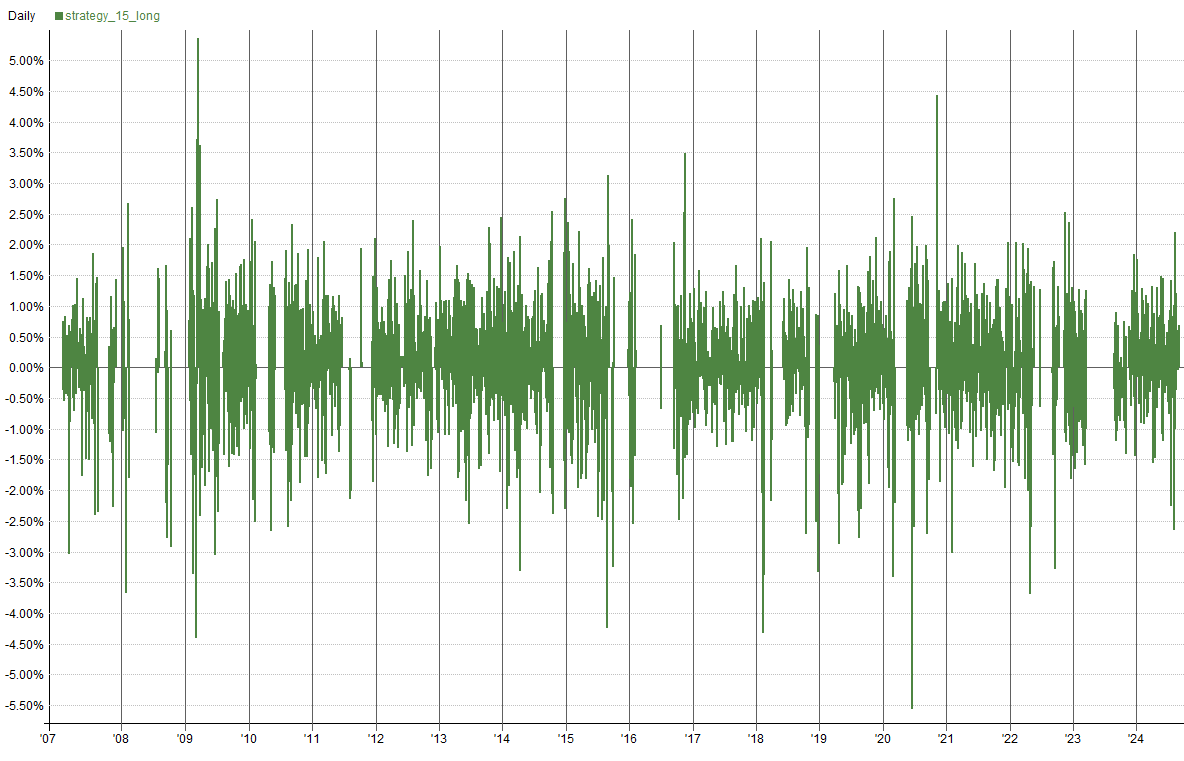
Key Metrics: Key metrics are from the latest backtest date in the date range above in the test settings.
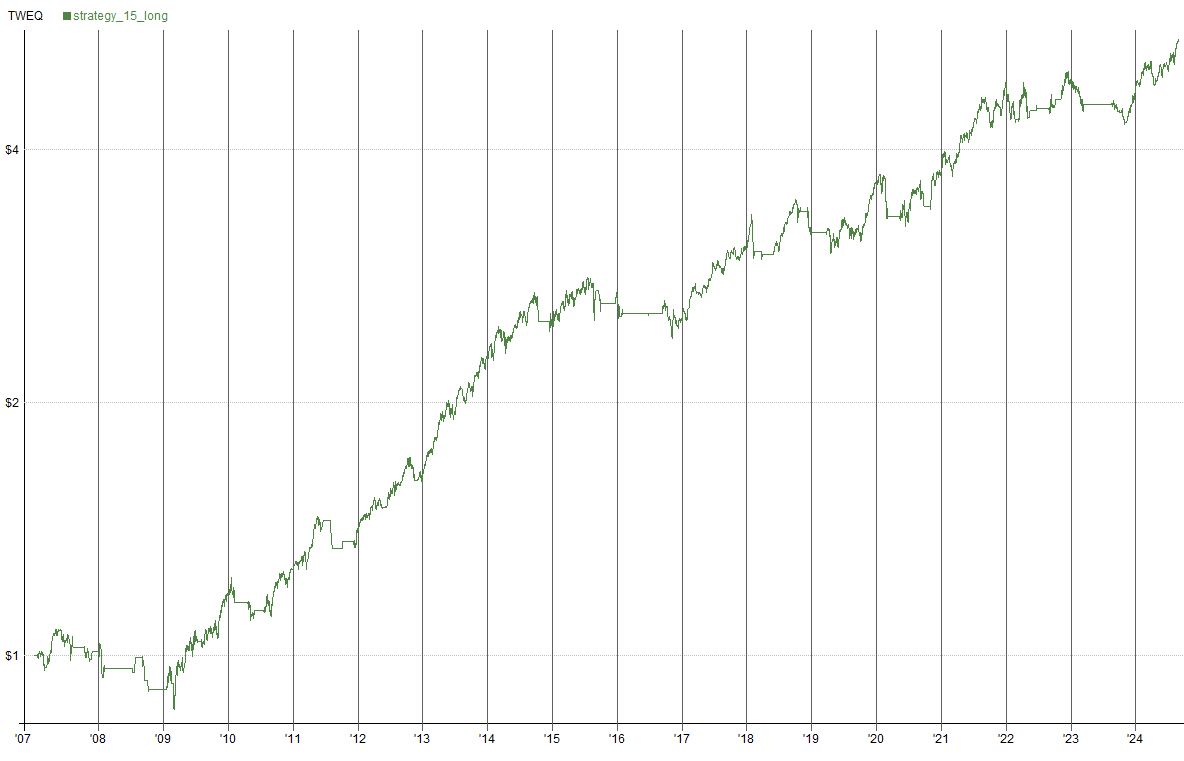
- Compound Annual Return: 10.12%
- Max Historical Drawdown: -19.64%
- Average Holding Period: 31.5 Days
- Expectancy Per Trade: 1.97%
- Win Rate: 59.79%
- Profit Factor: 3.44
- Sharpe Ratio: 0.88
- MAR Ratio: 0.52
Settings
| Setting | Value |
|---|---|
| Bar Size | Daily |
| Account Size Start | $100,000 |
| Data Source | Norgate |
| Universe | XLV |
| Date Range | 01/01/2007 to 09/01/2024 |
| Platform/Engine | RealTest |
| Use Available Bars | False |
Summary Stats (Strategy 15)
| strategy_15_long | |
|---|---|
| Periods | 4,433 |
| NetProfit | $443,646 |
| Comp | True |
| ROR | 10.12% |
| MaxDD | -19.64% |
| MAR | 0.52 |
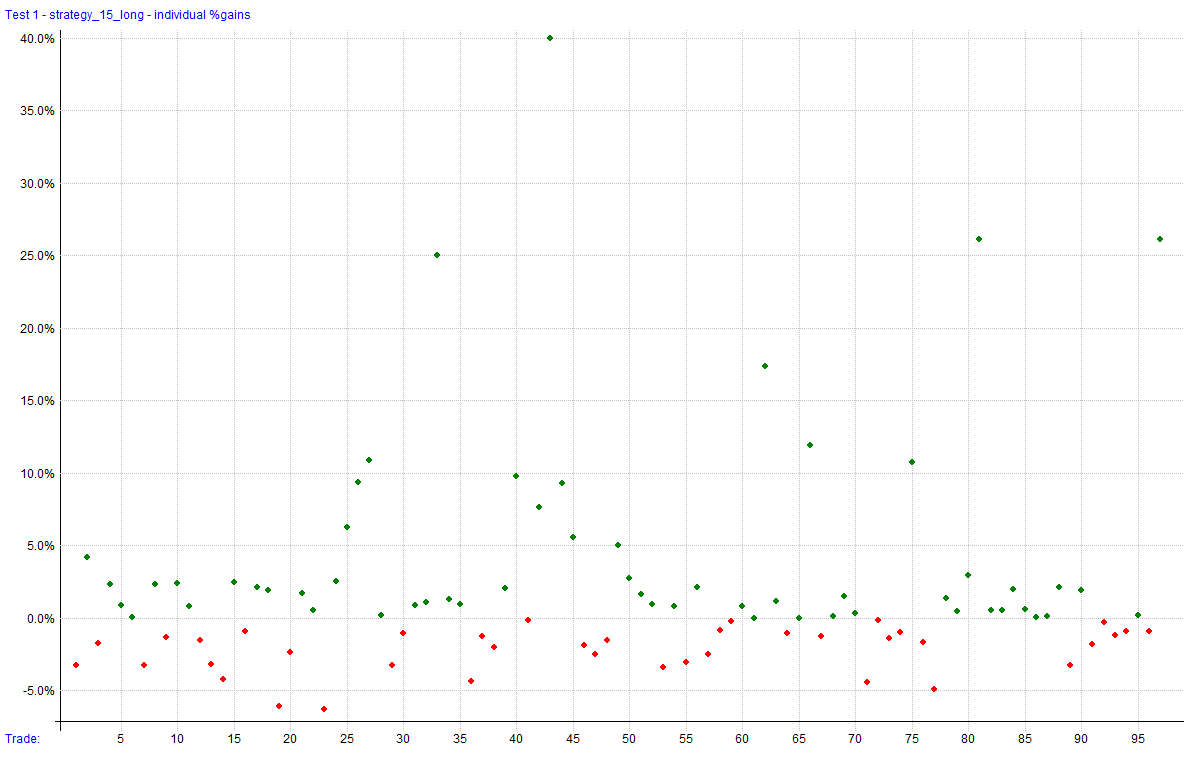
| Trades | 97 |
| PctWins | 59.79% |
| AvgWin | 4.78% |
| AvgLoss | 2.21% |
| WinLen | 43.86 |
| LossLen | 13.13 |
| Expectancy | 1.97% |
| ProfitFactor | 3.44 |
| Sharpe | 0.88 |
| AvgExp | 69.03% |
| MaxExp | 102.91% |
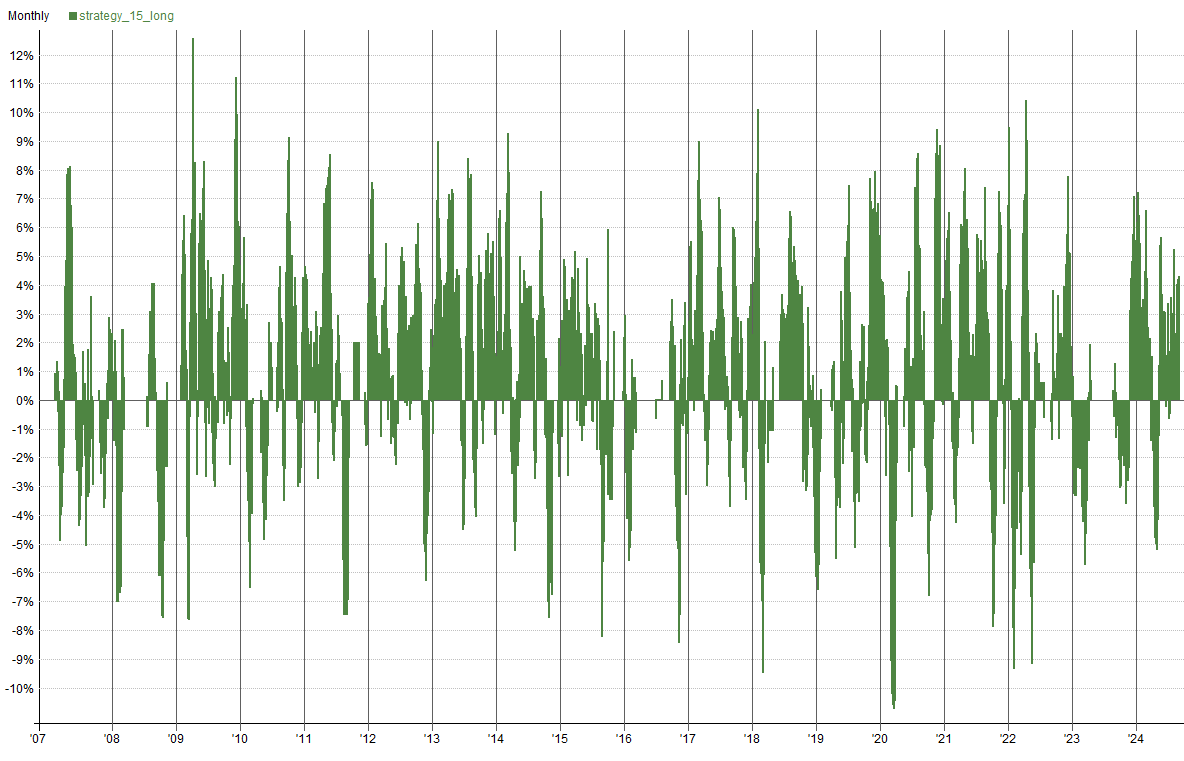
Combined Monthly Percent Gains
| YEAR | Jan | Feb | Mar | Apr | May | Jun | Jul | Aug | Sep | Oct | Nov | Dec | TOTAL | MaxDD |
|---|---|---|---|---|---|---|---|---|---|---|---|---|---|---|
| 2007 | 0.3% | -2.3% | 0.5% | 7.3% | 1.7% | -3.3% | -2.4% | 1.0% | 0.0% | -0.3% | -0.7% | 0.0% | 1.3% | -8.5% |
| 2008 | -4.5% | -0.2% | 0.0% | 0.0% | 0.0% | 0.0% | 3.1% | 0.0% | -6.1% | -2.3% | 0.0% | 0.0% | -10.0% | -12.3% |
| 2009 | 1.8% | -2.3% | 7.4% | -0.1% | 6.8% | 2.3% | -2.0% | 2.1% | 0.6% | -2.1% | 9.3% | 1.8% | 27.9% | -10.9% |
| 2010 | 0.7% | -1.4% | 0.0% | -1.2% | -1.1% | 0.0% | 0.1% | -1.7% | 9.1% | 2.2% | -2.9% | 4.6% | 8.2% | -11.1% |
| 2011 | 0.6% | 3.1% | 1.8% | 6.4% | 2.5% | -0.2% | -0.6% | -6.9% | 0.0% | 2.0% | 0.0% | 3.0% | 11.6% | -8.5% |
| 2012 | 3.2% | 1.1% | 4.5% | -0.3% | -1.9% | 5.0% | 1.0% | 1.2% | 3.8% | -0.2% | -3.3% | -0.1% | 14.5% | -7.4% |
| 2013 | 7.6% | 1.3% | 6.2% | 3.0% | 1.6% | -0.6% | 7.1% | -3.5% | 3.2% | 4.2% | 4.6% | 0.7% | 40.9% | -5.2% |
| 2014 | 0.9% | 6.2% | -1.3% | -0.6% | 2.9% | 1.1% | 1.6% | 0.3% | 0.2% | -0.2% | 2.0% | 1.4% | 10.5% | -9.3% |
| 2015 | 1.3% | 4.3% | 0.6% | -1.1% | 4.5% | -0.4% | 2.9% | -4.9% | -1.0% | 0.0% | 0.0% | 1.6% | -9.3% | -11.1% |
| 2016 | -3.3% | -1.0% | 0.0% | 0.0% | 0.0% | 0.0% | 0.0% | 0.0% | 1.8% | -6.5% | 2.0% | 0.7% | -6.4% | -10.7% |
| 2017 | 2.3% | 6.3% | -0.5% | 1.5% | 0.8% | 4.5% | 0.8% | 1.7% | 0.9% | -0.7% | 2.8% | -0.5% | 21.4% | -3.7% |
| 2018 | 6.4% | -6.0% | -1.1% | 0.0% | 0.0% | 1.3% | 6.6% | 4.3% | 3.0% | -2.7% | 0.0% | -5.8% | 5.0% | -11.5% |
| 2019 | 0.0% | 0.0% | 1.1% | -2.7% | -2.2% | 6.6% | -1.6% | -0.6% | -0.1% | 5.1% | 5.0% | 3.5% | 14.3% | -6.8% |
| 2020 | -2.6% | -6.6% | 0.5% | 0.0% | 3.6% | -2.4% | 5.4% | 2.6% | -5.8% | -0.8% | 7.9% | 3.8% | 4.6% | -13.3% |
| 2021 | 1.4% | -2.1% | 4.0% | 3.9% | 1.9% | 2.3% | 4.9% | 2.3% | -5.4% | 5.1% | -3.1% | 9.0% | 25.9% | -8.0% |
| 2022 | -6.8% | -2.7% | 6.1% | -5.0% | 1.7% | 0.6% | 0.0% | -1.4% | 1.6% | 2.2% | 7.2% | -1.9% | 0.7% | -10.1% |
| 2023 | -1.8% | -4.6% | 0.1% | 0.0% | 0.0% | 0.0% | 0.0% | -0.0% | -1.8% | -3.1% | 4.2% | 4.3% | -3.0% | -11.3% |
| 2024 | 2.9% | 3.2% | 2.4% | -5.0% | 2.4% | 1.8% | 2.6% | 5.0% | n/a | n/a | n/a | n/a | 16.1% | -6.3% |
| AVG | 0.6% | -0.2% | 1.8% | 10.5% | -9.3% | -1.6% | - | - | - | - | - | - | -9.3% | - |
Visualizations

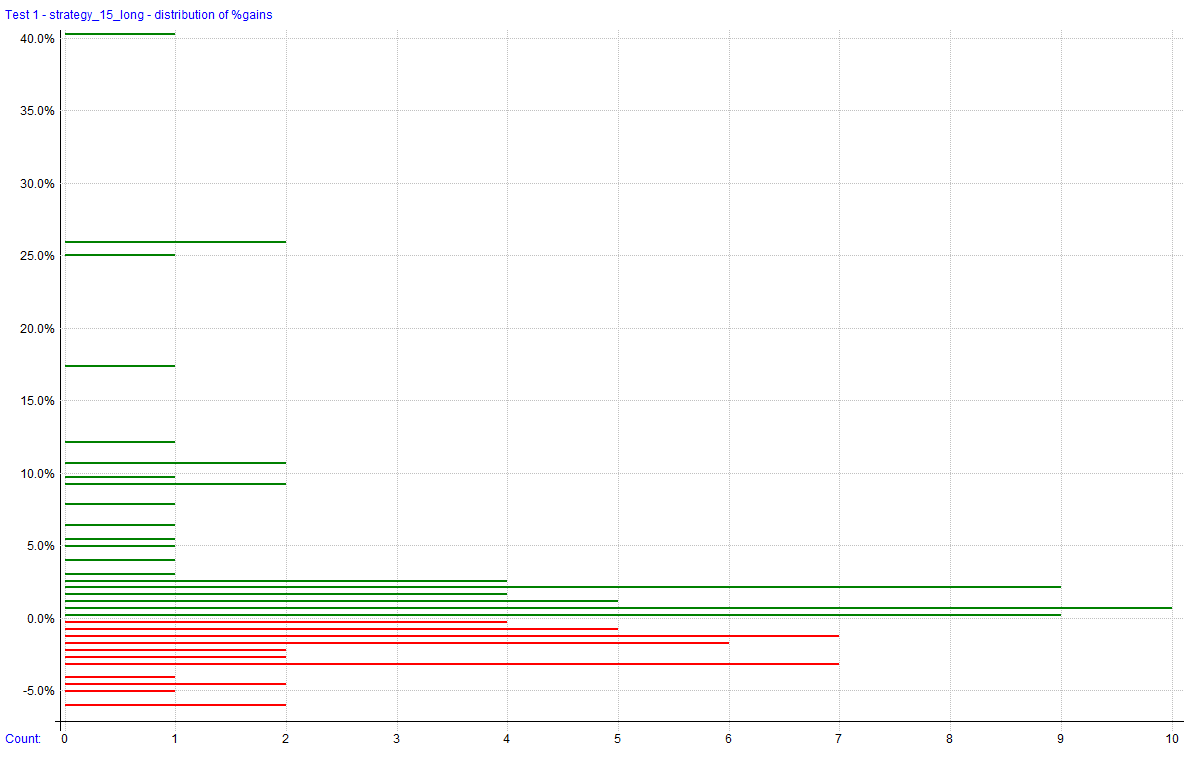
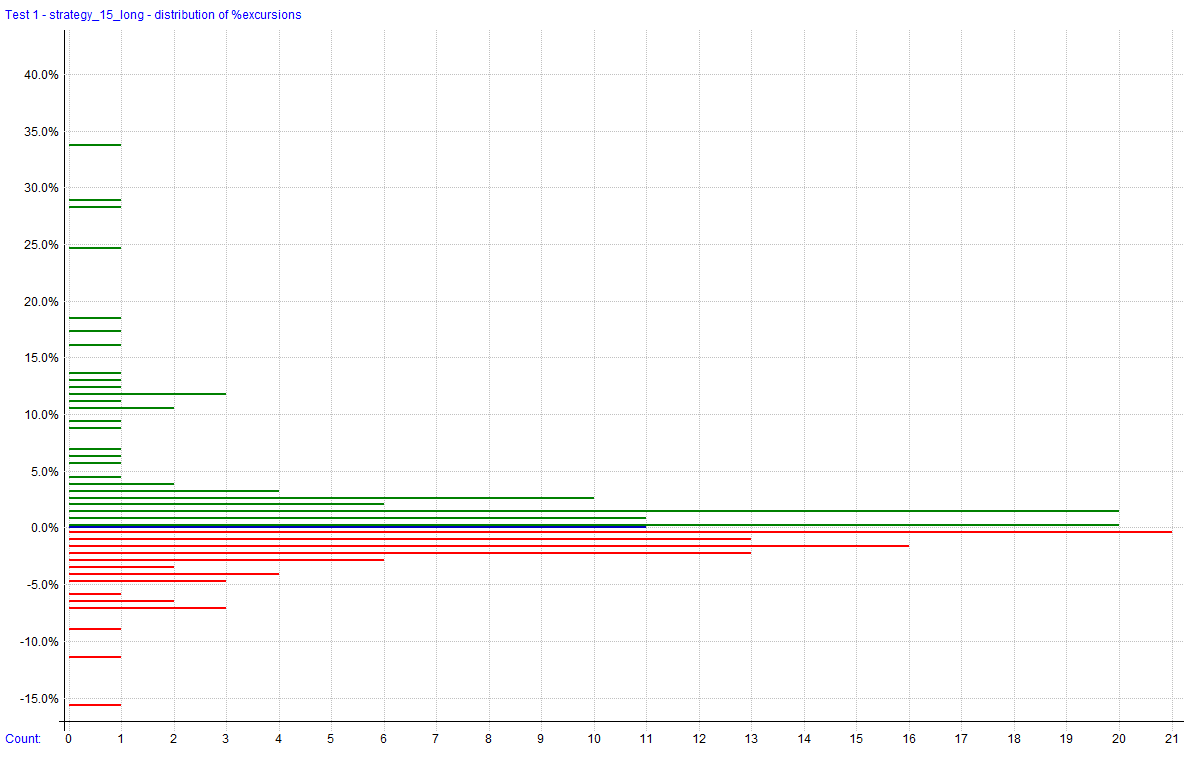
Trade Plots
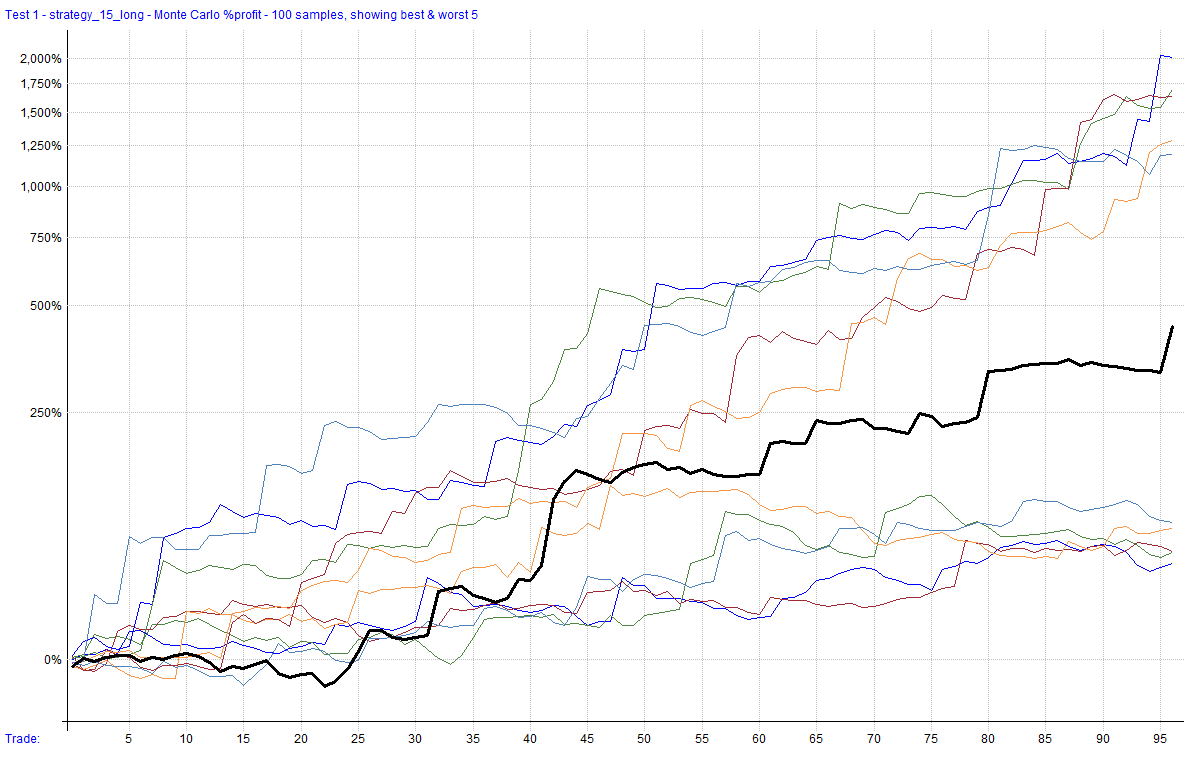
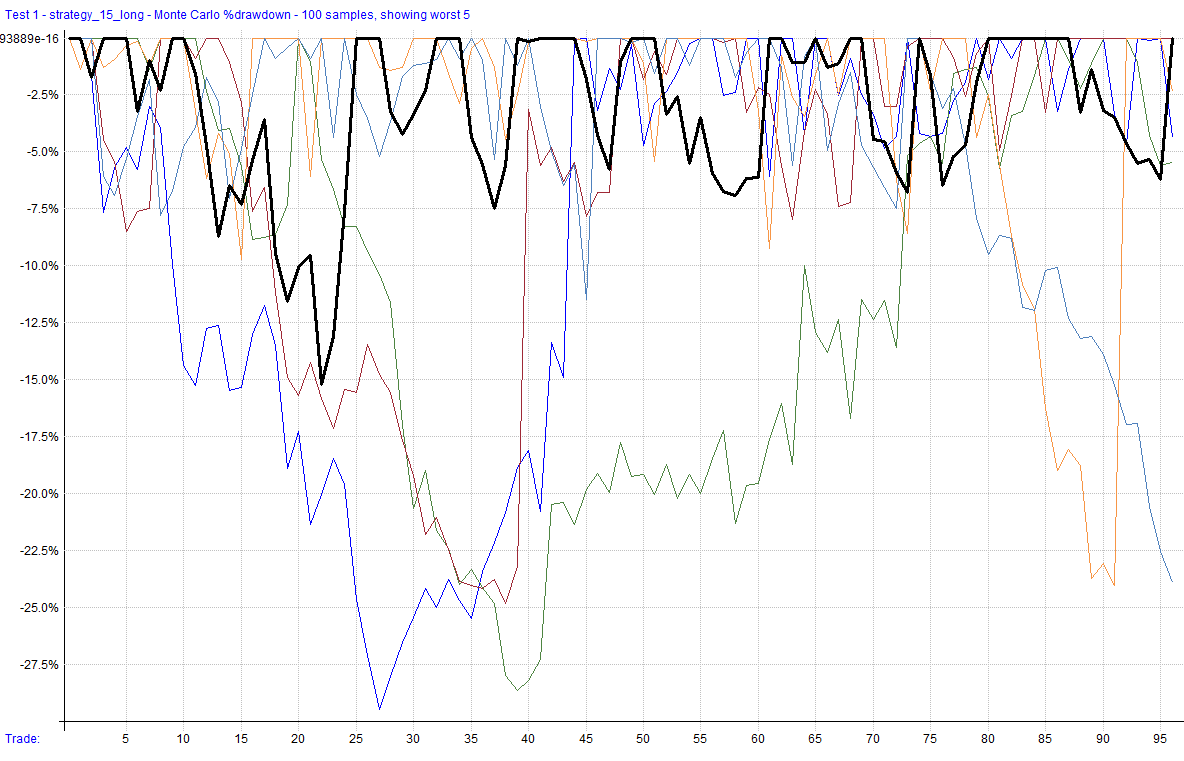
Monte Carlo Analysis
The results for this strategy indicate significant variability with a wide range of outcomes. While the backtest shows strong performance, the Monte Carlo simulations suggest potential vulnerabilities, likely due to the aggressive money flow parameters or the reliance on specific market conditions.
| Percentile | Net Profit | CAR | Max Drawdown |
|---|---|---|---|
| 1% | 72.11% | 3.13% | -31.01% |
| 5% | 102.64% | 4.08% | -26.75% |
| 10% | 125.09% | 4.71% | -22.87% |
| 20% | 198.55% | 6.40% | -19.61% |
| 50% | 363.18% | 9.08% | -11.66% |
| 80% | 702.85% | 12.53% | -8.12% |
| 90% | 929.05% | 14.13% | -6.20% |
| 95% | 1,289.84% | 16.09% | -5.76% |
| 99% | 2,230.64% | 19.54% | -3.24% |
| backtest | 443.65% | 10.07% | -19.64% |
Generated by RealTest. These results are subject to change based on parameter adjustments or further development.