21 ES/NQ
A trend-following anchored VWAP strategy for ES/NQ contracts. This strategy leverages anchored Volume Weighted Average Price (VWAP) alongside ATR-based risk management to identify and capitalize on market trends. Originally designed as separate long and short strategies, it has been unified into a cohesive approach that dynamically adjusts to market conditions. The strategy allows for overnight holds to enhance flexibility and performance.
This document will be updated as the strategy is developed, deployed (live or simulation), or distributed. Once discontinued, it will be noted here. The change log can be used to track adjustments and improvements over time.
Strategy 21 ES/NQ
Strategy Features:
- Anchored VWAP Trend-Following
- Trades ES/NQ Contracts
- Utilizes ATR for Risk Management
- Daily Bar Size
- Commissions & Slippage Included in Backtest
Key Metrics
From latest backtest covering 1/2/2015 – 12/27/24
- Rate of Return (ROR): 26.36%
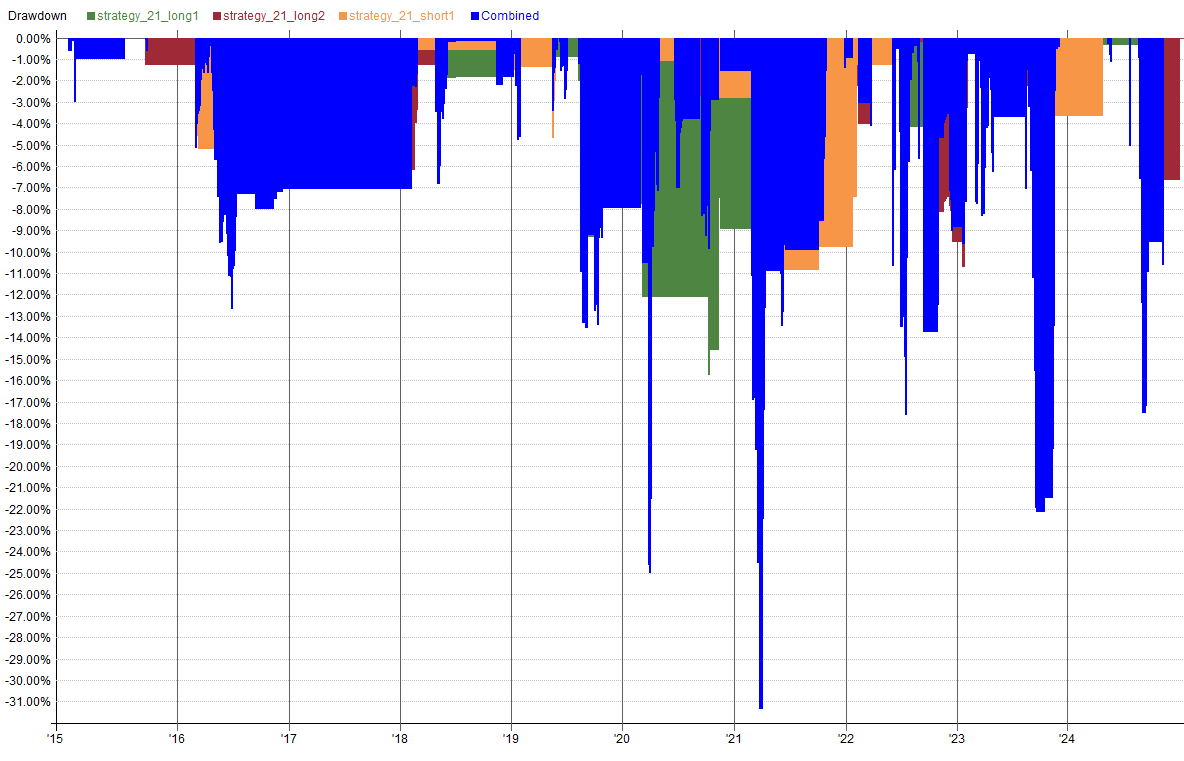
- Max Historical Drawdown: -31.33%
- Expectancy Per Trade: 0.52%
- Win Rate: 57.29%
- Profit Factor: 2.36
- Sharpe Ratio: 1.07
- MAR Ratio: 0.84
Settings
| Setting | Value |
|---|---|
| Bar Size | Daily |
| Account Size Start | $100,000 |
| Data Source | Norgate |
| Universe | ES/NQ |
| Date Range | 01/02/2015 to 12/27/2024 |
| Platform/Engine | RealTest |
| Use Available Bars | False |
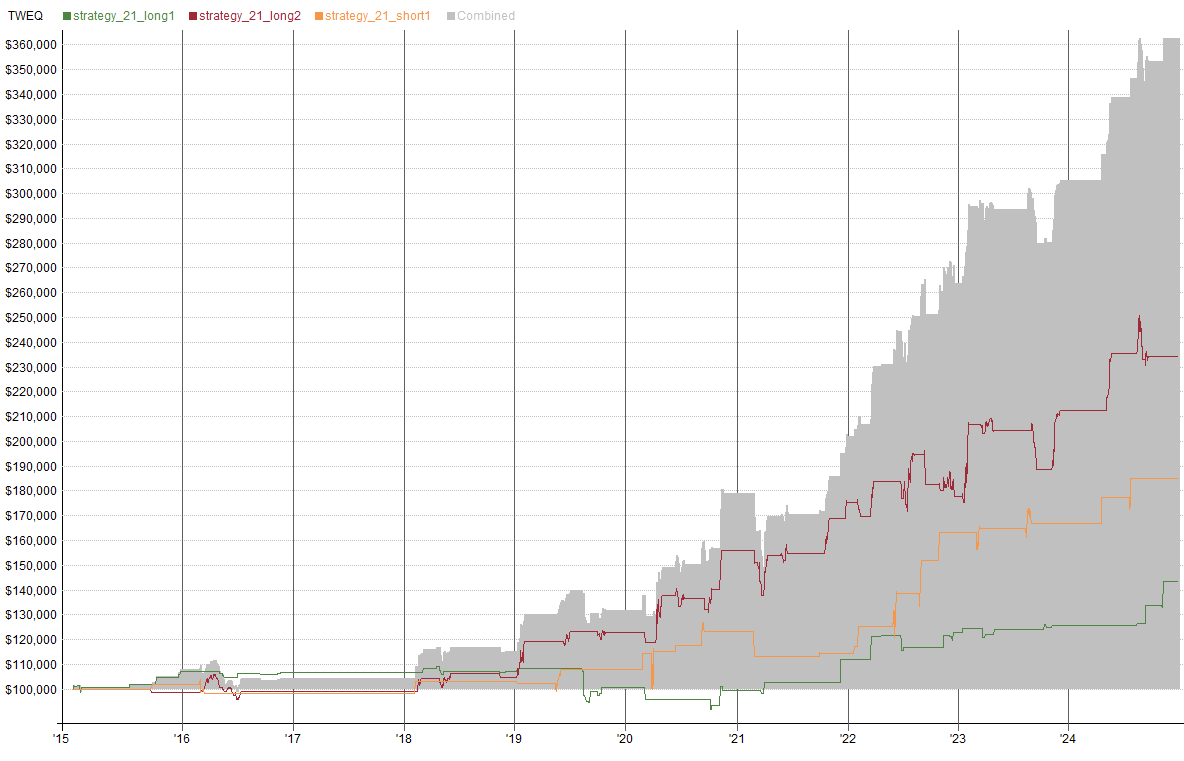
Summary Stats (Strategy 21 ES/NQ)
| strategy_21_long1 | strategy_21_long2 | strategy_21_short1 | Combined | |
|---|---|---|---|---|
| Periods | 2,511 | 2,336 | 2,335 | 2,511 |
| NetProfit | $43,503 | $134,066 | $85,212 | $262,782 |
| Comp | False | False | False | False |
| ROR | 4.36% | 14.45% | 9.19% | 26.36% |
| MaxDD | -15.77% | -11.71% | -12.65% | -31.33% |
| MAR | 0.28 | 1.23 | 0.73 | 0.84 |
| Trades | 86 | 83 | 30 | 199 |
| PctWins | 63.95% | 42.17% | 80.00% | 57.29% |
| AvgWin | 0.74% | 3.04% | 1.73% | 1.66% |
| AvgLoss | 0.86% | 1.04% | 1.65% | 1.01% |
| Expectancy | 0.17% | 0.68% | 1.05% | 0.52% |
| TradeLen | 0.00 | 5.14 | 2.97 | 2.59 |
| AvgWinAmt | $1,723.09 | $7,285.36 | $4,444.67 | $4,003.77 |
| AvgLossAmt | $1,653.77 | $2,519.19 | $3,576.58 | $2,278.21 |
| ExpectAmt | $505.85 | $1,615.26 | $2,840.42 | $1,320.51 |
| ProfitFactor | 1.85 | 2.11 | 4.97 | 2.36 |
| Sharpe | 0.52 | 0.87 | 0.63 | 1.07 |
| Volatility | 7.50% | 11.25% | 11.62% | 24.75% |
| Skew | 5.41302 | 1.97586 | 2.63671 | 1.57624 |
| Sortino | 0.93 | 1.49 | 1.07 | 1.82 |
| Skipped | 0.00% | 0.00% | 0.00% | 0.00% |
| AvgExp | 0.00% | 26.66% | 6.61% | 45.61% |
| MaxExp | 0.00% | 344.15% | 438.53% | 695.15% |
| AvgUse | 6.32% | 28.85% | 7.89% | 57.44% |
| MaxUse | 464.36% | 347.76% | 440.20% | 985.39% |
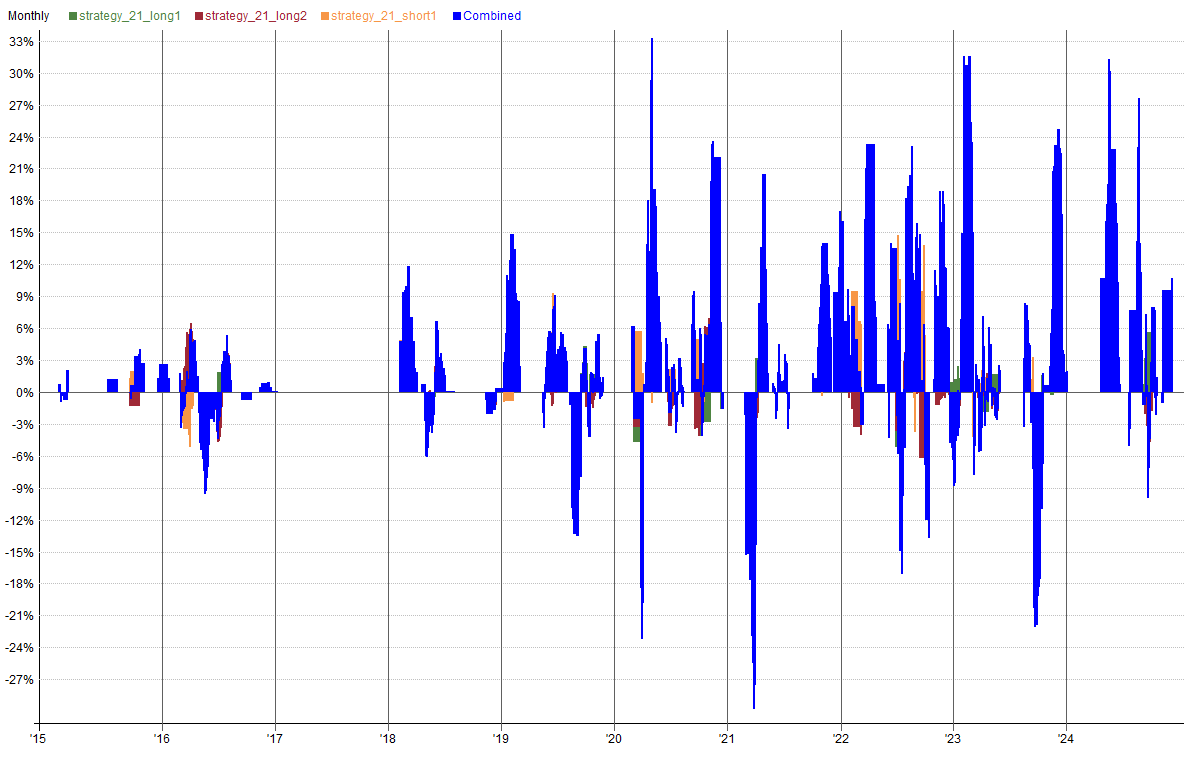
Combined Monthly Percent Gains (Strategy 21 ES/NQ)
| YEAR | Jan | Feb | Mar | Apr | May | Jun | Jul | Aug | Sep | Oct | Nov | Dec | TOTAL | MaxDD |
|---|---|---|---|---|---|---|---|---|---|---|---|---|---|---|
| 2015 | -1.3% | 2.0% | 0.0% | 0.0% | 0.0% | 0.0% | 1.2% | 0.0% | 0.7% | 2.7% | 0.0% | 2.6% | 8.0% | -3.0% |
| 2016 | 0.0% | 1.8% | 0.3% | -2.9% | -3.7% | -2.8% | 3.5% | 0.0% | -0.7% | 0.0% | 0.8% | 0.1% | -3.6% | -12.7% |
| 2017 | 0.0% | 0.0% | 0.0% | 0.0% | 0.0% | 0.0% | 0.0% | 0.0% | 0.0% | 0.0% | 0.0% | 0.0% | 0.0% | -0.0% |
| 2018 | 0.0% | 10.0% | 1.8% | -2.8% | 1.7% | 1.6% | 0.0% | 0.0% | 0.0% | 0.0% | -1.7% | 0.0% | 10.7% | -6.8% |
| 2019 | 14.9% | 0.0% | 0.0% | 0.0% | 5.2% | 1.7% | 2.9% | -13.6% | 4.3% | 1.3% | 0.0% | 0.0% | 16.7% | -13.6% |
| 2020 | 0.0% | 6.2% | -19.8% | 30.9% | 0.0% | -2.0% | 3.2% | 0.0% | 1.6% | 5.0% | 22.0% | 0.0% | 47.1% | -23.3% |
| 2021 | 0.0% | -2.2% | -27.6% | 20.4% | 0.6% | 0.4% | 0.0% | 0.0% | 1.7% | 13.6% | 0.0% | 16.0% | 23.0% | -29.8% |
| 2022 | 3.0% | 2.0% | 23.3% | 0.7% | 2.8% | -2.3% | 18.2% | 13.9% | -12.1% | 10.1% | 11.2% | -8.9% | 61.9% | -17.7% |
| 2023 | 13.9% | 16.9% | -0.5% | -0.5% | 0.0% | 0.0% | 0.0% | 4.6% | -18.4% | 0.6% | 23.7% | 1.1% | 41.3% | -22.1% |
| 2024 | 0.0% | 0.0% | 0.0% | 10.7% | 22.8% | 0.0% | 7.7% | 4.0% | 2.8% | 0.0% | 9.6% | 0.0% | 57.6% | -17.6% |
| AVG | 3.0% | 3.7% | -2.2% | 5.7% | 2.9% | -0.3% | 3.7% | 0.9% | -2.0% | 3.3% | 6.6% | 1.1% | 26.3% | -14.6% |
Strategy Correlations
Returns
| RETURNS | strategy_21_long1 | strategy_21_long2 | strategy_21_short1 | Combined |
|---|---|---|---|---|
| strategy_21_long1 | 1.00 | 0.20 | -0.00 | 0.46 |
| strategy_21_long2 | 0.20 | 1.00 | -0.02 | 0.74 |
| strategy_21_short1 | -0.00 | -0.02 | 1.00 | 0.54 |
| Combined | 0.46 | 0.74 | 0.54 | 1.00 |
Drawdowns
| DRAWDOWNS | strategy_21_long1 | strategy_21_long2 | strategy_21_short1 | Combined |
|---|---|---|---|---|
| strategy_21_long1 | 1.00 | -0.14 | 0.09 | 0.26 |
| strategy_21_long2 | -0.14 | 1.00 | 0.25 | 0.68 |
| strategy_21_short1 | 0.09 | 0.25 | 1.00 | 0.42 |
| Combined | 0.26 | 0.68 | 0.42 | 1.00 |
Visualizations
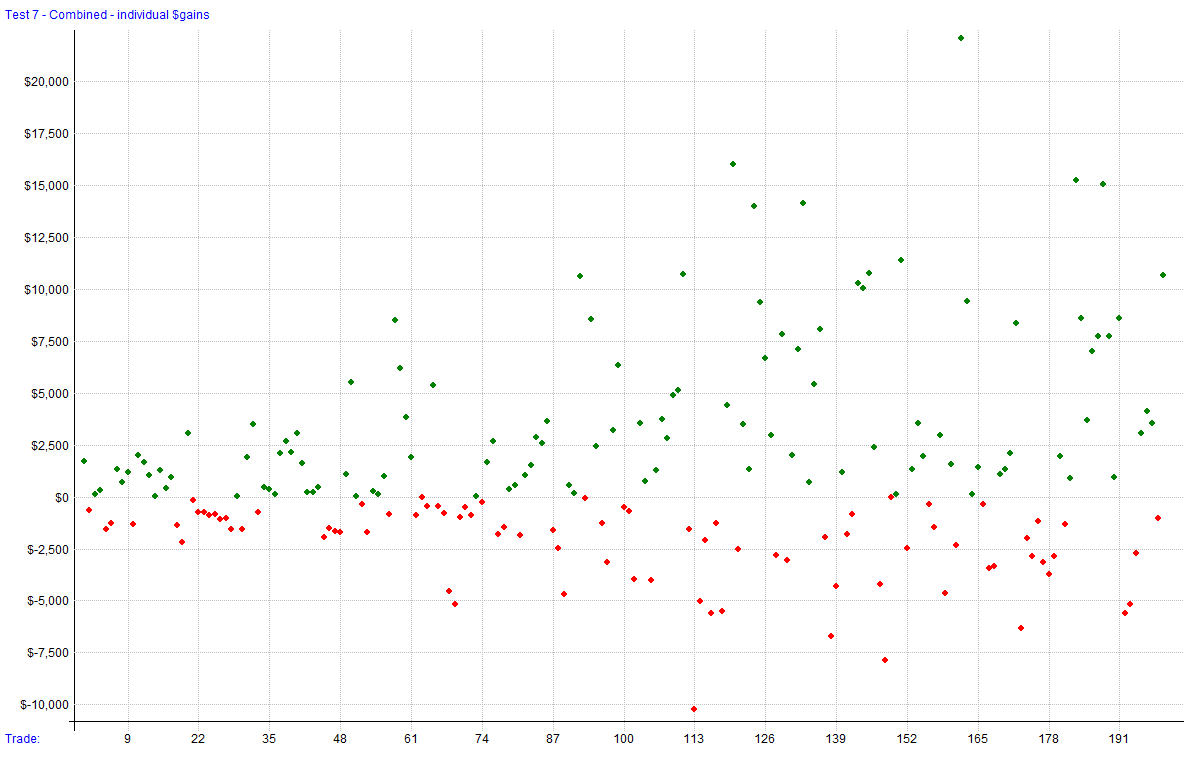
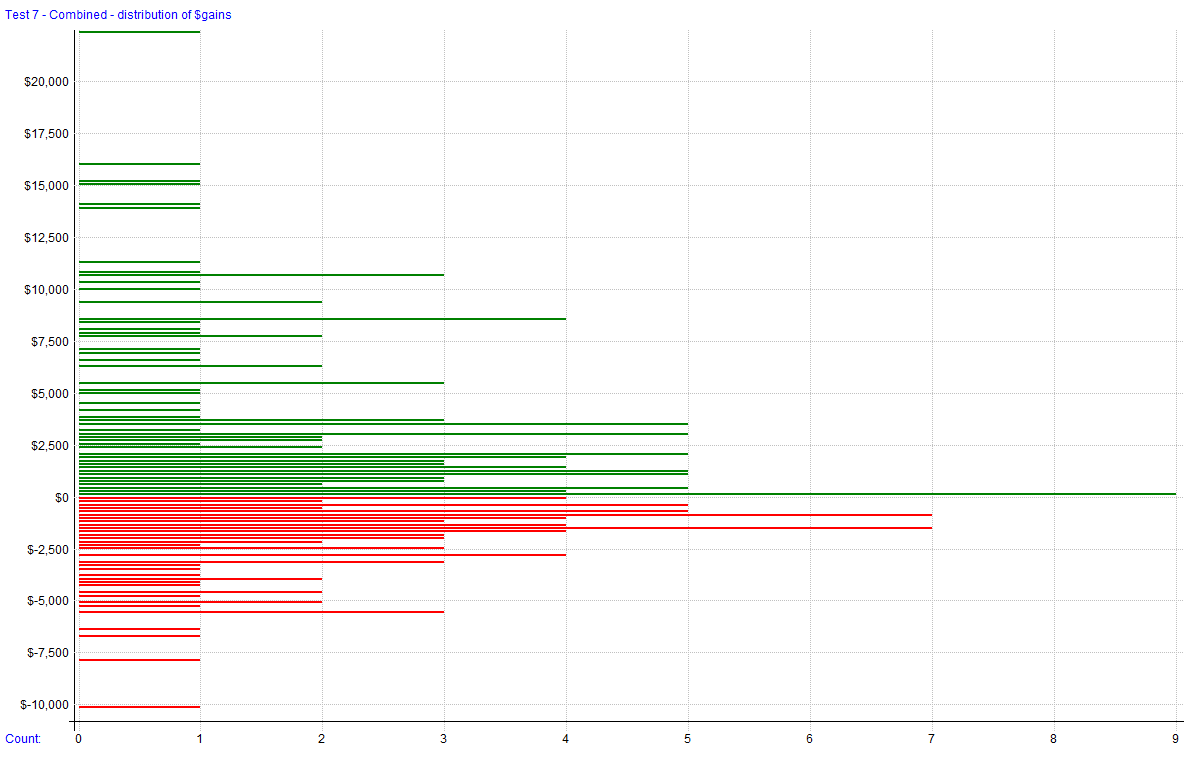
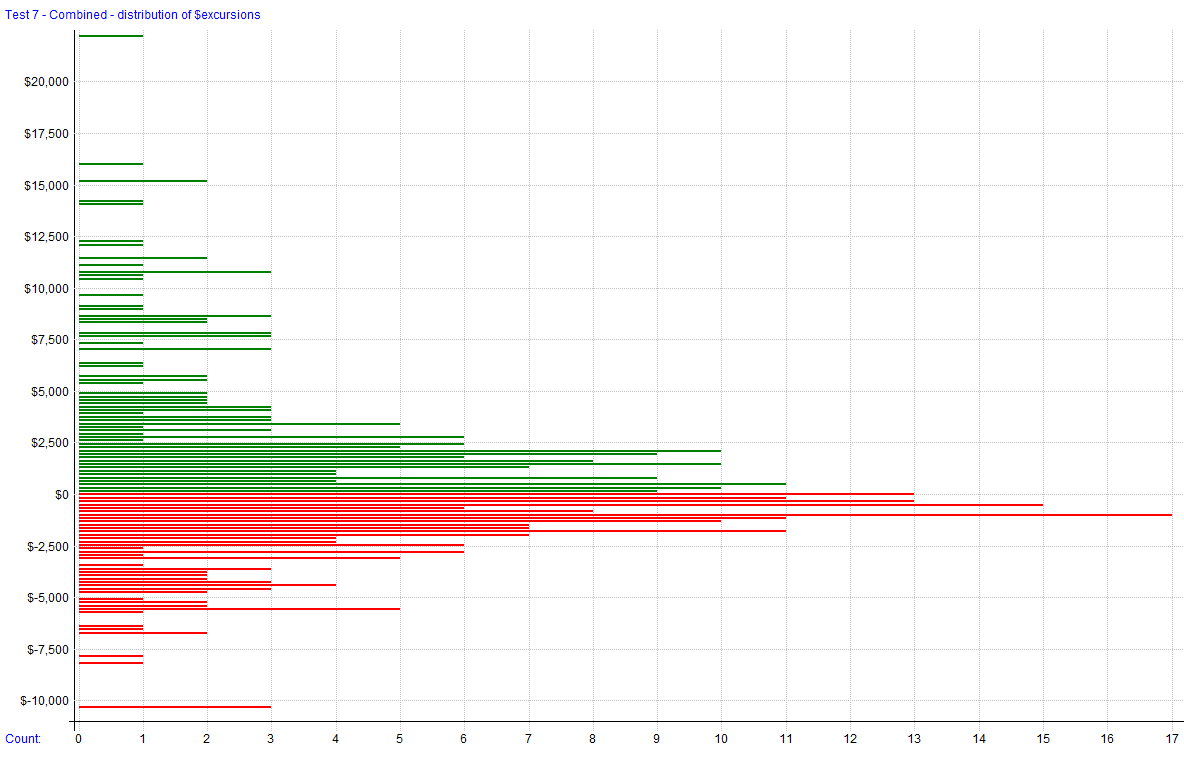
Trade Plots
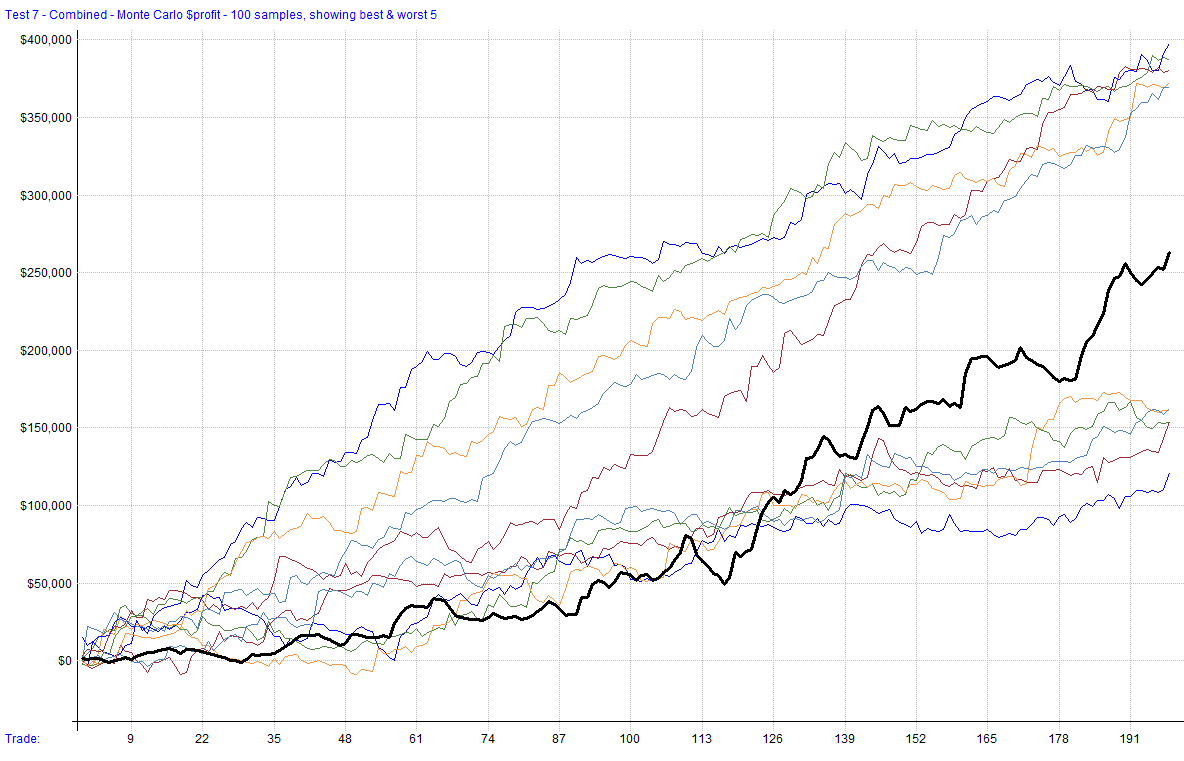
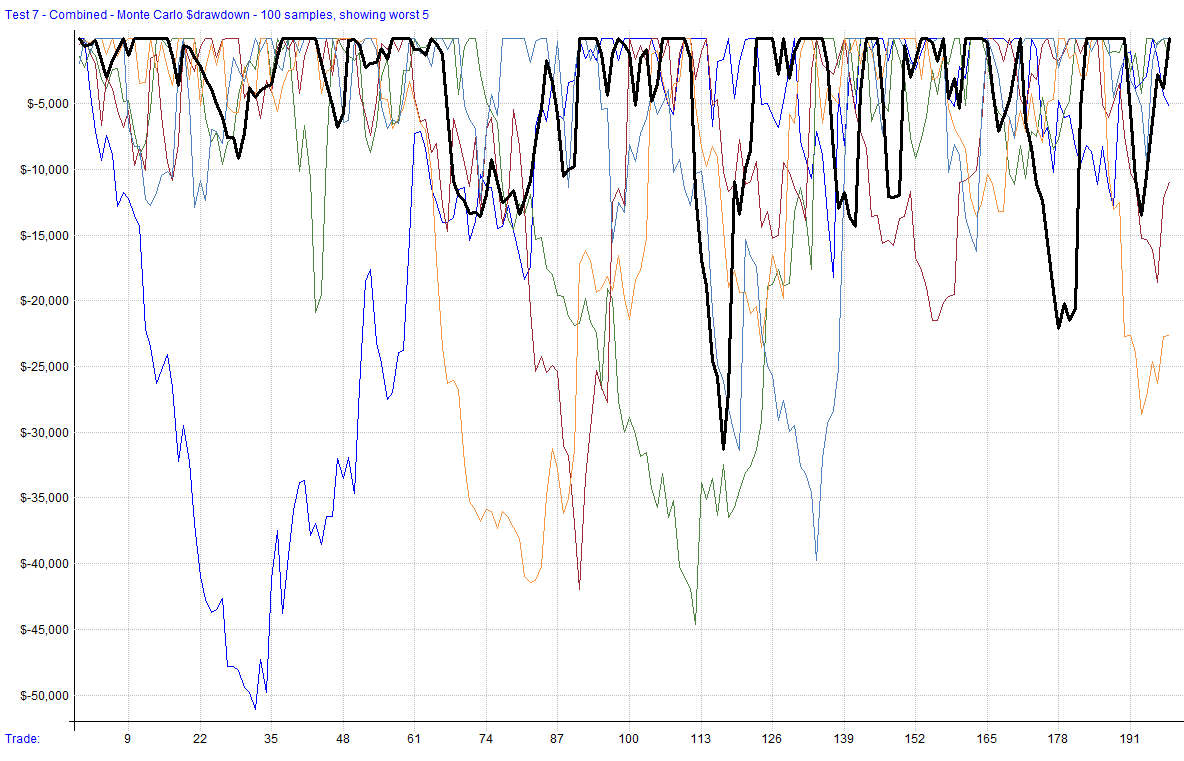
Monte Carlo Analysis (Strategy 21 ES/NQ)
| Percentile | Net Profit | AAR | Max Drawdown |
|---|---|---|---|
| 1% | $153,647 | $15,395 | ($47,046) |
| 5% | $162,410 | $16,273 | ($37,308) |
| 10% | $182,204 | $18,257 | ($33,737) |
| 20% | $216,510 | $21,694 | ($31,102) |
| 50% | $262,054 | $26,258 | ($24,536) |
| 80% | $307,754 | $30,837 | ($16,888) |
| 90% | $350,162 | $35,086 | ($14,744) |
| 95% | $372,404 | $37,314 | ($13,061) |
| 99% | $401,174 | $40,197 | ($12,046) |
| backtest | $262,782 | $26,330 | ($31,334) |
Generated by RealTest. These results are subject to change based on parameter adjustments or further development.