Strategy 18
An MACD-based trading strategy for BTC/Crypto ETFs, operating on long positions. The strategy utilizes a modified MACD indicator and a regime filter (using BTCUSD) to identify optimal entry and exit points, aiming to capitalize on trends in the Bitcoin market.
This document will be updated as the strategy is developed, deployed (live or simulation), or distributed. Once discontinued, it will be noted here. The change log can be used to track adjustments and improvements over time.
Strategy Features:
- Trend Strategy (Long Only)
- Trades BTC/Crypto ETFs
- Utilizes Modified MACD Indicator for Entry Signals and Exit
- Daily Bar Size for Analysis
- Commissions and Slippage Accounted for in Backtest Results
Key Metrics: Key metrics are from the latest backtest date in the date range above in the test settings.
- Rate of Return (ROR): 46.92%
- Max Historical Drawdown: -27.73%
- Expectancy Per Trade: 7.50%
- Win Rate: 52.00%
- Profit Factor: 5.75
- Sharpe Ratio: 1.29
- MAR Ratio: 1.69
Settings
| Setting | Value |
|---|---|
| Bar Size | Daily |
| Account Size Start | $100,000 |
| Data Source | Norgate/TiingoCrypto |
| Universe | BTC/Crypto ETFs |
| Date Range | 01/01/2017 to 11/25/2024 |
| Platform/Engine | RealTest |
| Use Available Bars | False |
Summary Stats (Strategy 18)
| strategy_18_long | |
|---|---|
| Periods | 2,882 |
| NetProfit | $1,945,245 |
| Comp | True |
| ROR | 46.92% |
| MaxDD | -27.73% |
| MAR | 1.69 |
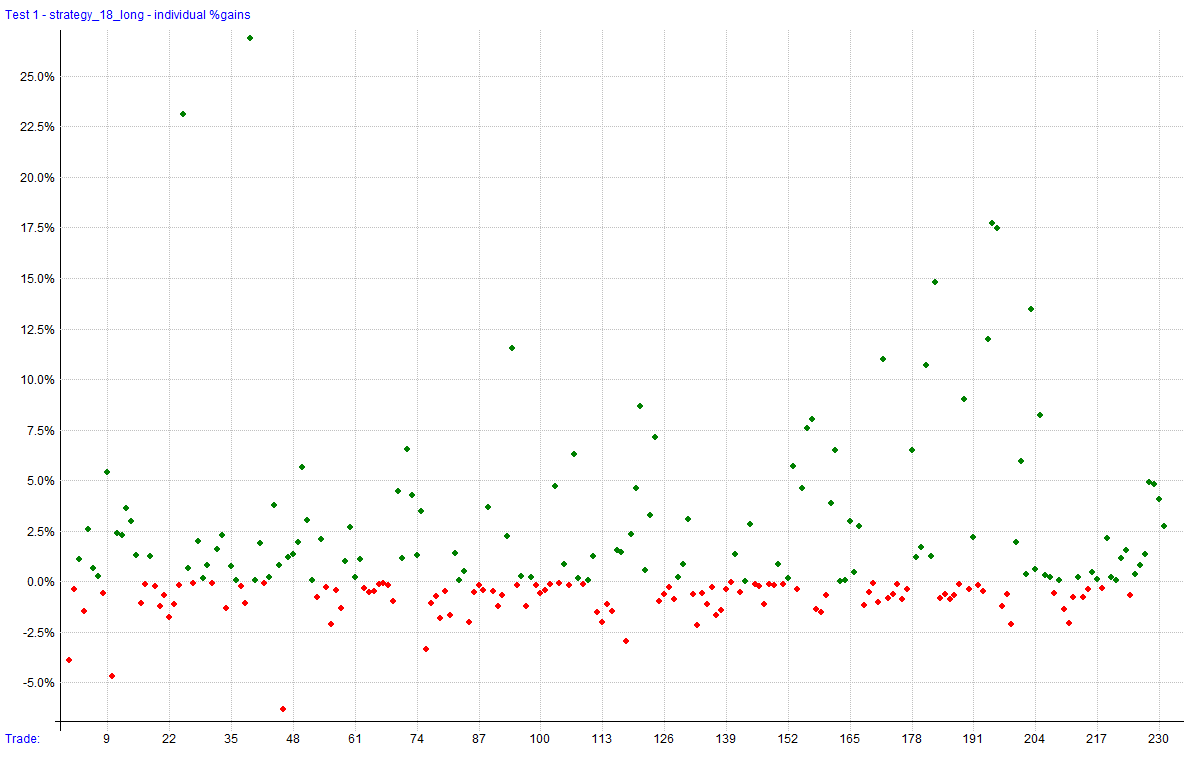
| Trades | 225 |
| PctWins | 52.00% |
| AvgWin | 18.62% |
| AvgLoss | 4.54% |
| WinLen | 19.16 |
| LossLen | 5.40 |
| Expectancy | 7.50% |
| ProfitFactor | 5.75 |
| Sharpe | 1.29 |
| AvgExp | 30.49% |
| MaxExp | 100.16% |
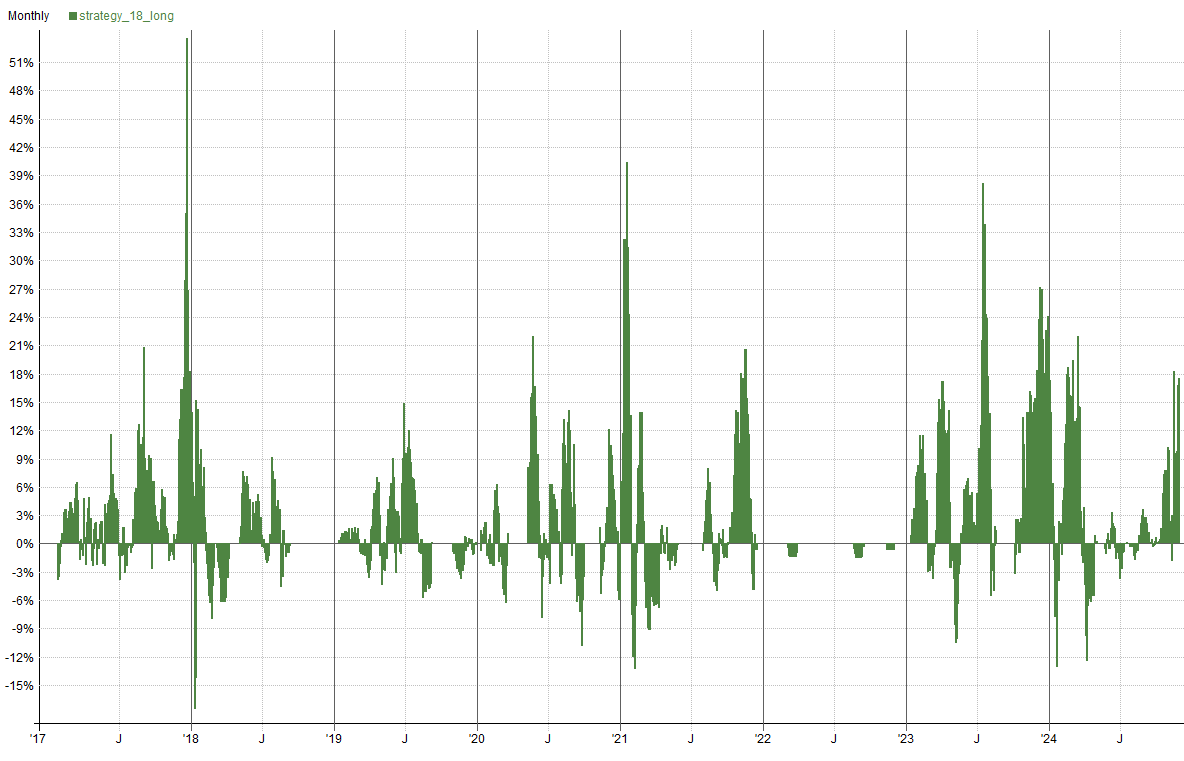
Combined Monthly Percent Gains
| YEAR | Jan | Feb | Mar | Apr | May | Jun | Jul | Aug | Sep | Oct | Nov | Dec | TOTAL | MaxDD |
|---|---|---|---|---|---|---|---|---|---|---|---|---|---|---|
| 2017 | -3.4% | 3.9% | 5.4% | 0.5% | 3.7% | 1.2% | -0.2% | 28.7% | -0.2% | 19.8% | 10.5% | 16.6% | 120.7% | -27.7% |
| 2018 | 13.4% | -8.0% | -6.2% | 0.0% | 7.9% | 2.1% | 1.6% | 1.4% | 0.0% | 0.0% | 0.0% | 0.0% | 11.2% | -13.7% |
| 2019 | 1.5% | 1.6% | -4.7% | 3.2% | 4.1% | 8.1% | -2.0% | -4.4% | 0.0% | -0.7% | -1.4% | -1.1% | 3.6% | -12.2% |
| 2020 | -1.7% | 0.9% | 0.0% | 0.0% | 13.9% | -0.7% | 1.3% | 11.6% | -6.4% | 0.0% | 6.0% | 4.7% | 31.6% | -14.2% |
| 2021 | 10.5% | 1.6% | -5.1% | 4.7% | -0.7% | 0.0% | -1.0% | 0.8% | -1.2% | 11.4% | 12.9% | 0.0% | 37.5% | -17.8% |
| 2022 | 0.0% | 0.0% | -1.4% | 0.0% | 0.0% | 0.0% | 0.0% | -1.5% | 0.0% | 0.0% | -0.6% | 0.0% | -3.5% | -3.5% |
| 2023 | 7.2% | 3.0% | 16.8% | -1.2% | 3.8% | 6.4% | 23.6% | 0.0% | 0.0% | 7.3% | 27.7% | 29.6% | 208.4% | -11.5% |
| 2024 | -5.5% | 28.4% | 5.5% | -3.9% | -0.5% | 0.0% | -0.1% | 2.1% | 0.0% | 3.4% | 15.5% | n/a | 49.4% | -10.6% |
| AVG | 2.7% | 3.9% | 1.3% | 0.4% | 4.0% | 2.1% | 2.9% | 4.8% | -1.0% | 5.2% | 8.8% | 7.1% | 57.4% | -13.9% |
Visualizations
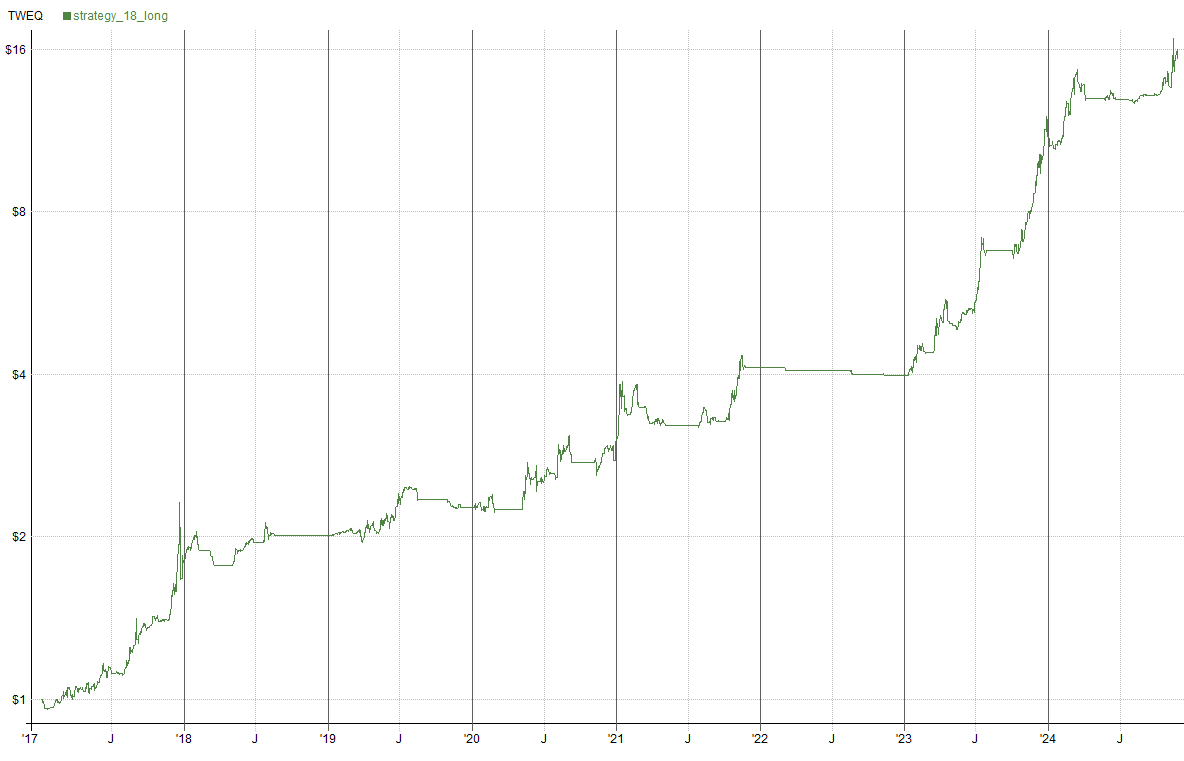

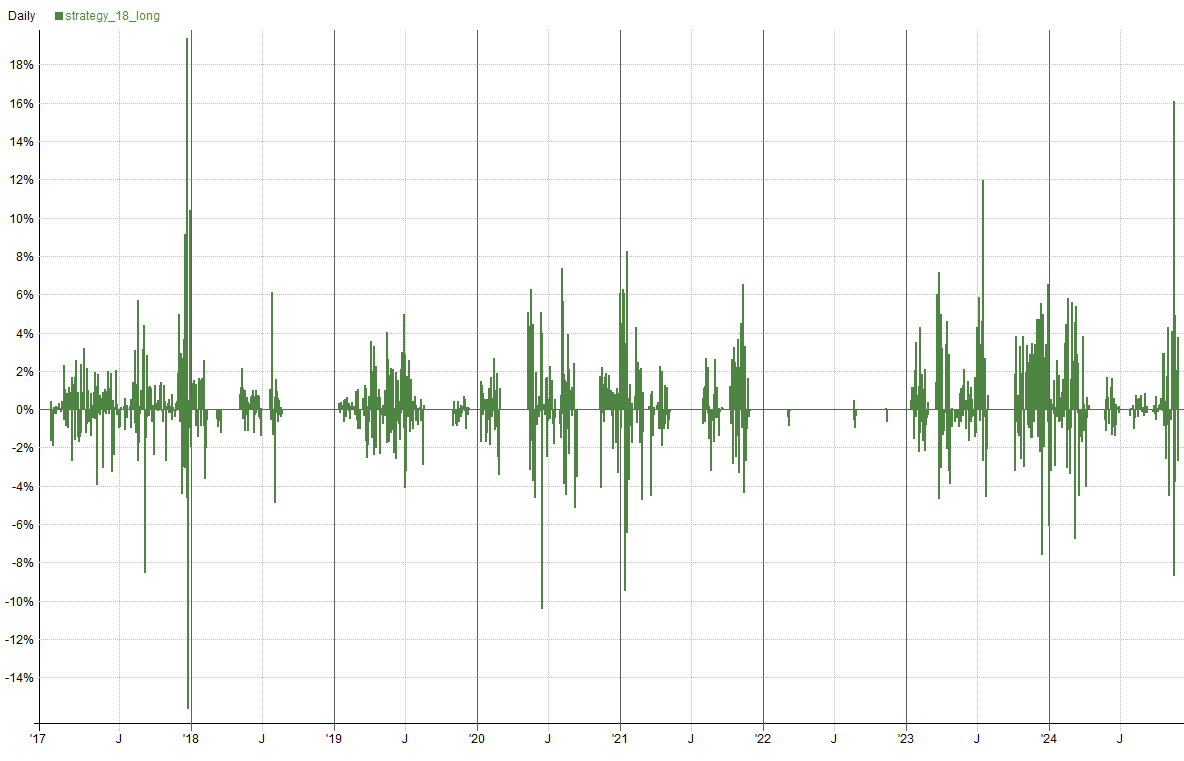
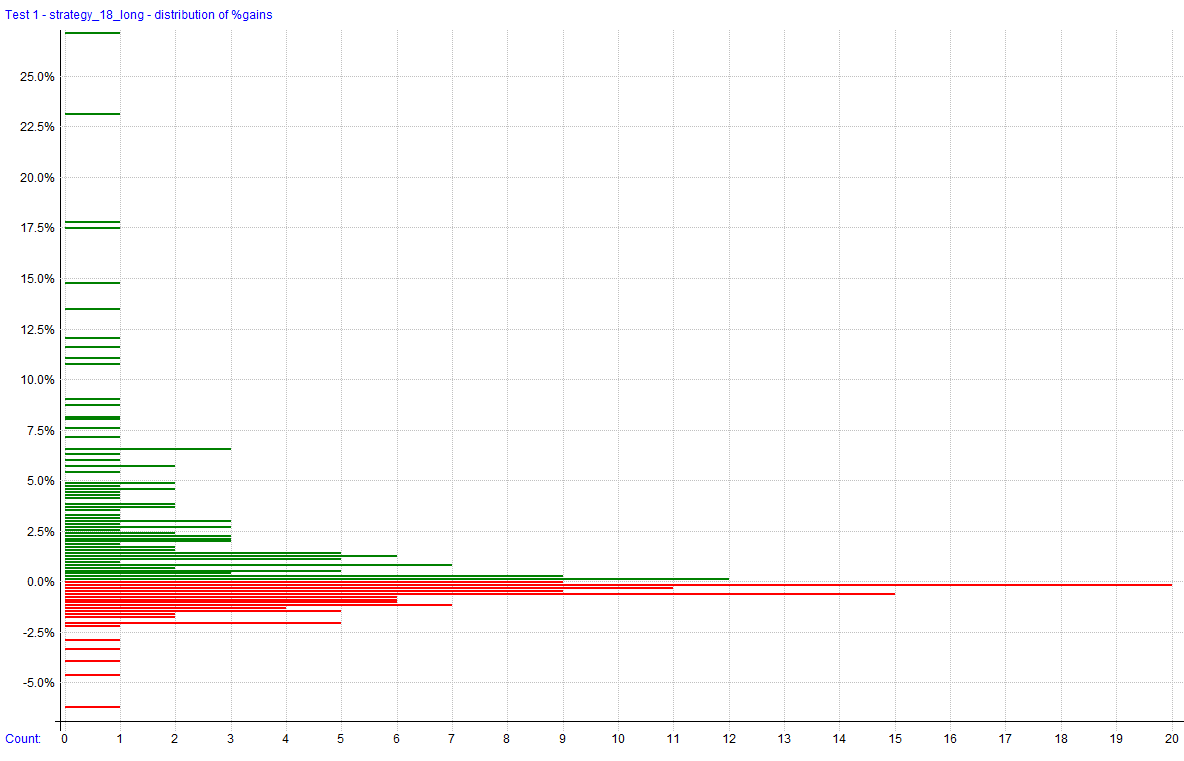
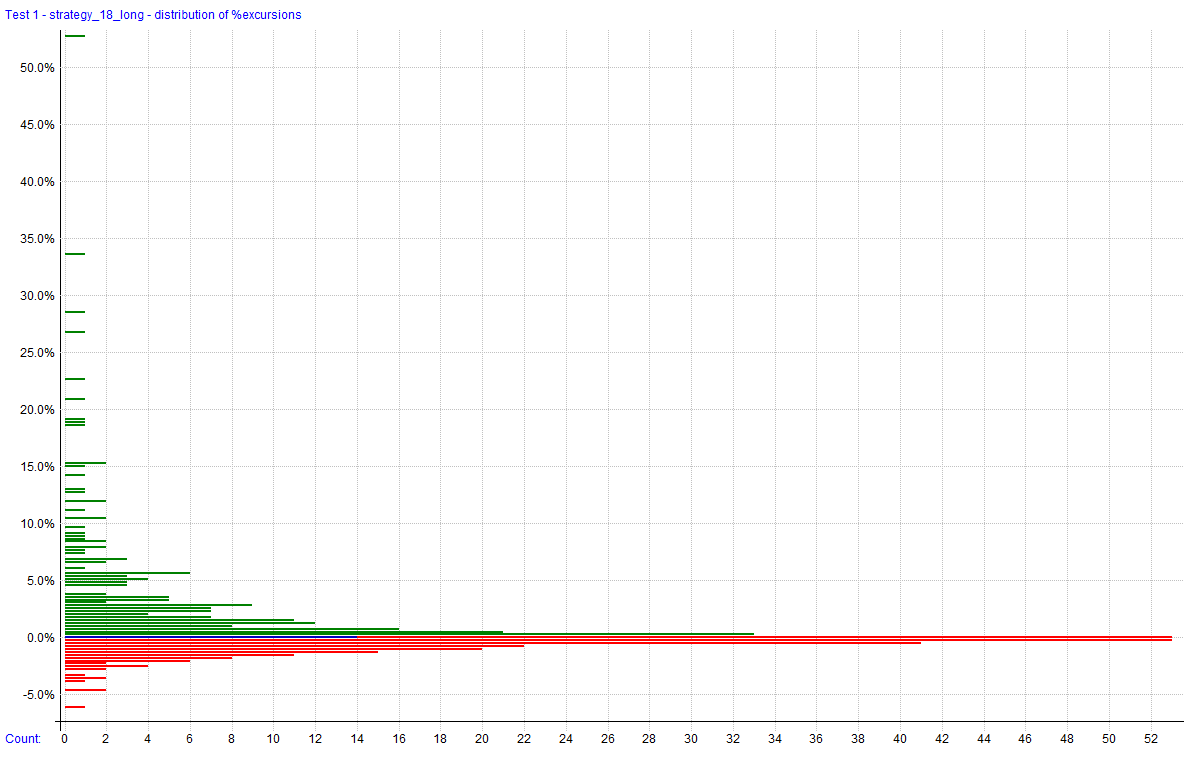
Trade Plots
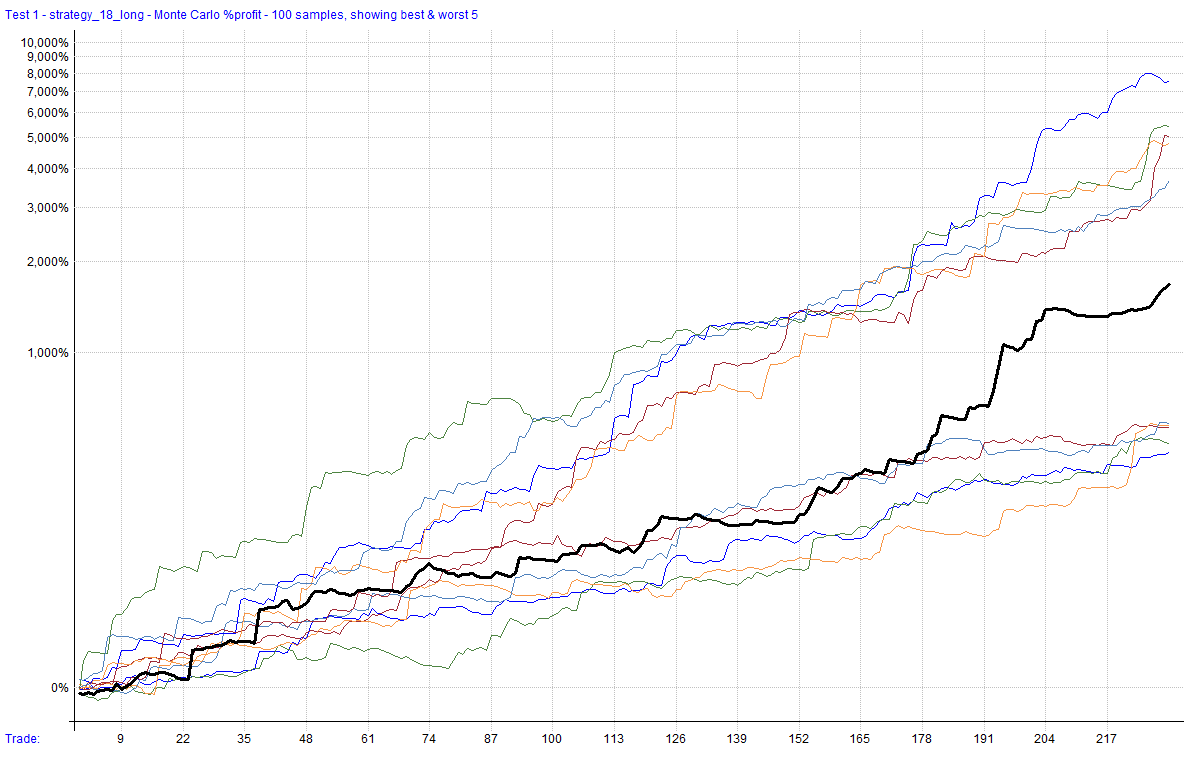
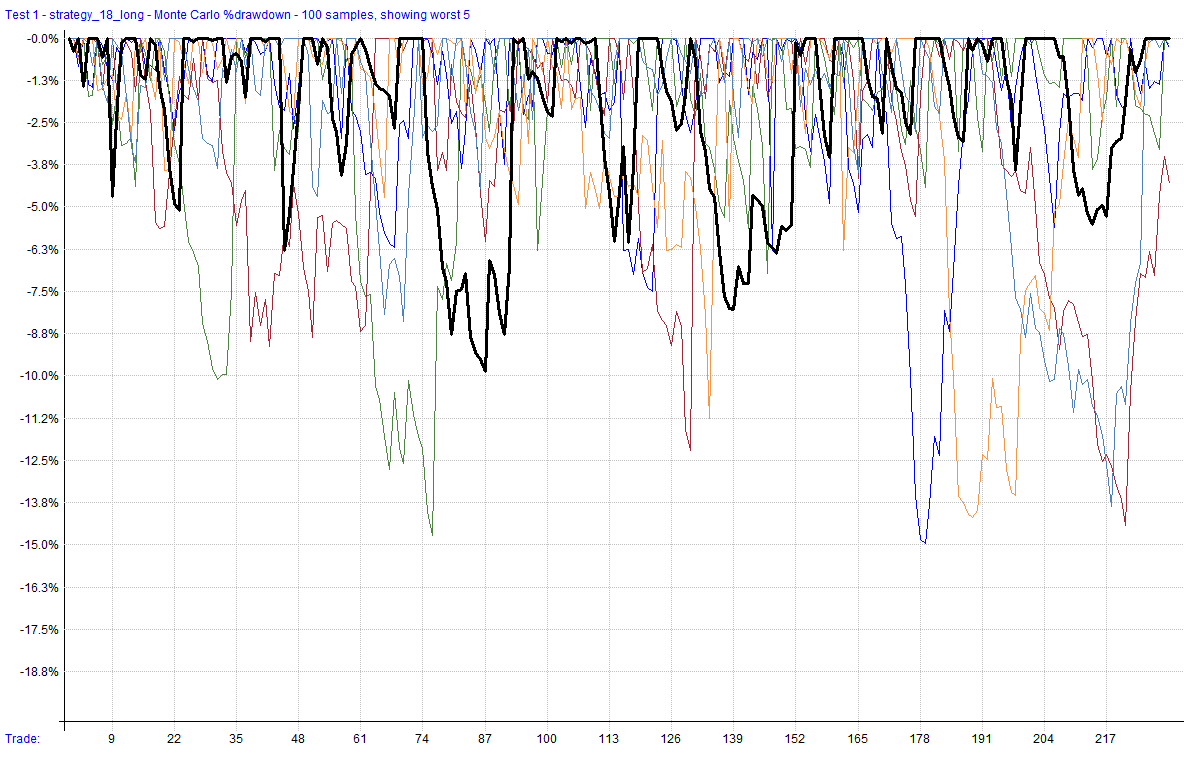
Monte Carlo Analysis
| Percentile | Net Profit | CAR (%) | Max Drawdown |
|---|---|---|---|
| 1% | 378.31% | 14.64% | -19.12% |
| 5% | 776.85% | 20.87% | -13.90% |
| 10% | 957.16% | 22.86% | -11.96% |
| 20% | 1,260.71% | 25.60% | -9.65% |
| 50% | 2,227.47% | 31.63% | -6.52% |
| 80% | 3,914.86% | 38.05% | -4.37% |
| 90% | 4,931.55% | 40.80% | -3.38% |
| 95% | 6,052.37% | 43.29% | -2.95% |
| 99% | 11,310.12% | 51.23% | -2.27% |
| Backtest | 1,945.24% | 30.15% | -27.73% |
Generated by RealTest. These results are subject to change based on parameter adjustments or further development.